
Shares and property had been great Investments for Australians. How does solar stack up against these?
Any savvy business owners or business leaders would always be thinking about where the best place to invest their money is. To get the best answer, it’s imperative to identify the best method to quantify different investments.
Many people try to quantify the financial benefits of a solar PV system by using the term ‘payback period’ or shortened to ‘payback’. Part of the reason is that many solar companies have been loosely using this term very frequently.
Payback in this context is just how long it takes until the break-even point of the investment has been reached.
It does provide a form of financial measure but not the whole picture. Let’s consider the disadvantages of the payback period approach:
- It makes investments in renewable energy or energy savings measures impossible to compare to other financial investments because payback time is not a term used with other investments such as shares or property.
- Let’s say a commercial solar system payback is 4 years, it does not account for the additional 21 years where a quality system will be producing electricity for free with only relatively low maintenance costs. This could amount to hundreds of thousands of dollars of benefit for a good-sized commercial solar system.
- Payback time does not take into account the time value of money.
Therefore, it does make sense to use Return on Investment (ROI) as a tool to compare different investments. Reasonable assumptions have been made in order to compare how investment in solar PV stack up against other asset classes in Australia. See below:
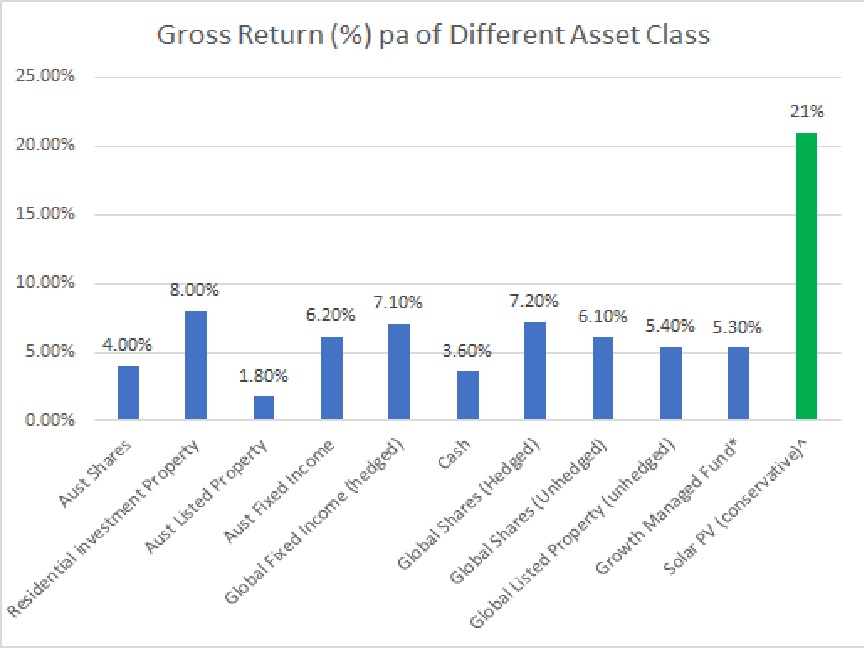
'2018 Russell Investments/ASX Long Term Investing Report’ has been used to construct this chart on different asset classes’ returns per annum over 10 years up to December 2017.
Notes:
a. ^Solar PV’s return is based on Free Engineer’s exposure to many sites with different circumstances (including different tariffs) from July 2016 Until March 2020. Rather than being pedantic and making it complex, we intend to use this expected average as an indicative yet insightful comparison. In some cases, we have even come across solar PV projects where the expected returns were close to 40% pa. Note that this return probably would be boosted further with the government’s economic response to the coronavirus issues – see here
b. Non-solar assets are based on 10 years to December 2017
c. *Only the before-tax returns have been calculated
Of course, businesses or business owners may also elect to invest in their own business, such as by expanding a new production line or employing a new staff member. The return (on paper) could be much higher than solar PV’s return. Yet, this return may be associated with some risks such as the changing market, performance risk, resource risk etc. It’s best to leave this assessment to the expertise of the associated business leaders.
Investing in solar PV correspond to certain risks such as the risk of the system not performing and the risk of grid electricity price dropping significantly. Free Engineer with extensive technical and financial backgrounds have helped previous clients minimise these risks to virtually negligible.
If you are open to benefit from over 20% of ROI with minimum risk, please contact us by emailing [email protected] Now for a free consultation with a specialist engineer.
P.S. We are not financial advisors or accountants. Please seek financial or accounting advice prior to making any decision.
Posted on Mar 26, 2020